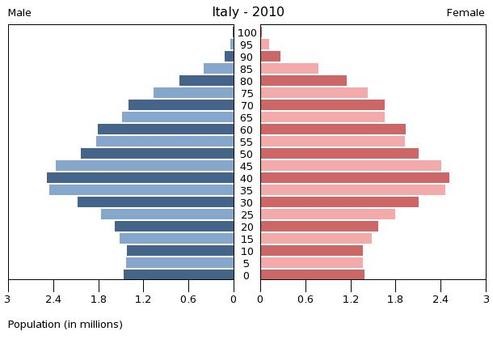
Figure 5: Italy Population Pyramid 2010
Birth rate: Low (8.01 births/1,000 population)
Death rate: High (10.83 deaths/1,000 population)
Life expectancy: 80.3 years.
Fertility rate: 1.4 births/woman, which is well below the replacement level of 2.1 births/woman and the world average of 2.5 births/woman.
Population growth: -0.075%.
Median Age: 43.7 years. Median age is predicted to rise to 58 by 2050. As can be seen in the comparison between figure 5 and 7, the bulk of Italy's population has aged from the 30-34 group to the 40-44 group.
Age Structure:
0-14 years: 13.5%
15-64 years: 66.3%
65 years and over: 20.2%
By 2050, 35.9% of Italians will be over 65
(CIA World Factbook, US Census Bureau and UNDP)
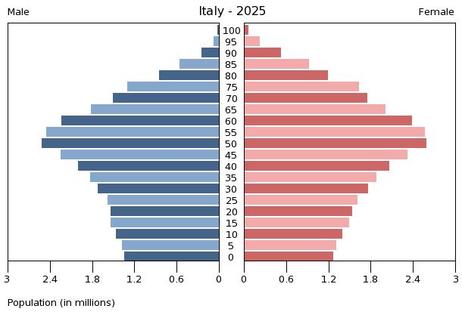
Figure 6: Italy Population Pyramid 2025
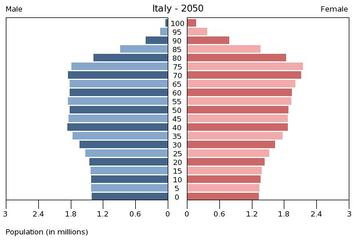
Figure 7: Italy Population Pyramid 2050
Demographic Transition
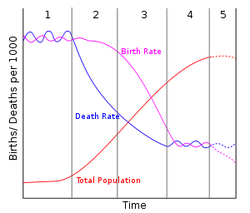
Figure 8: Demographic Transition Model
Italy is in stage 5 of the Demographic Transition Model. This is the stage where birth rates and death rates are low, with deaths possibly outnumbering births, as is the situation in Italy. As a result from this natural decrease in population, countries in this stage experience population aging and decline
